1. Introduction
For engineers and maintenance professionals, the ability to accurately read and interpret a Roots blower performance curve is not merely a technical skill—it’s a fundamental requirement for operational success. Selecting the wrong blower based on a misread curve can lead to catastrophic inefficiencies, frequent breakdowns, and significant energy waste. This guide demystifies the performance chart, the single most important document that encapsulates the blower’s capabilities. At its core, the curve maps the intricate relationships between four critical variables: Flow (Q), Pressure (ΔP), Power (BHP), and Rotational Speed (RPM). Mastering these relationships is the key to optimal system design and reliable operation.
2. Anatomy of a Roots Blower Performance Curve
The Roots Blower performance curve is a map, and to navigate it, you must first understand its coordinates.
Understanding the X and Y Axes
The standard performance curve for a Roots blower is plotted with a specific set of axes that define its operating envelope.
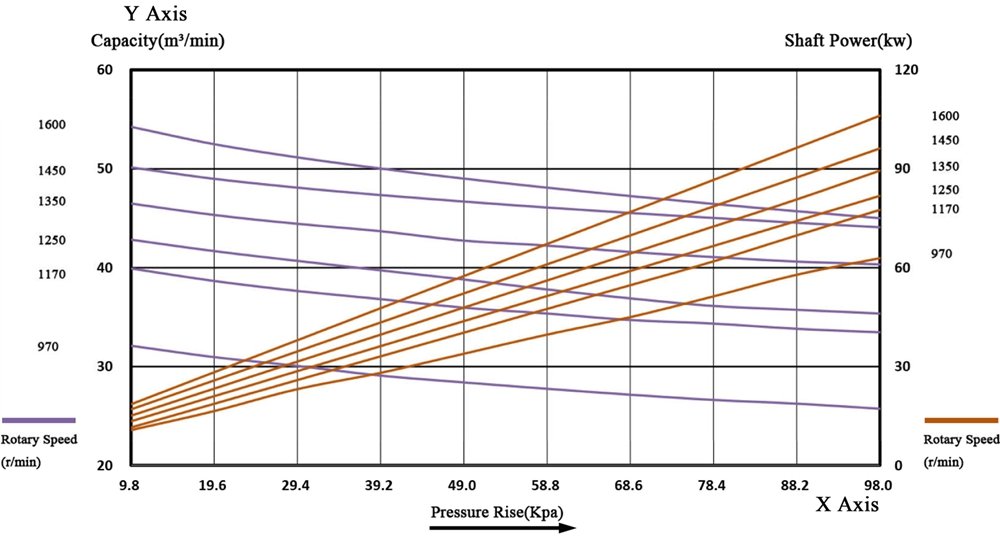
Differential Pressure (ΔP): The X-axis typically represents Differential Pressure. Unlike compressors that generate absolute pressure, Roots blowers are positive displacement air movers. Their primary function is to create a pressure difference between the outlet and the inlet. This ΔP, measured in psi, bar, or kPa, is the resistance the blower must overcome in your specific system (e.g., filter losses, pipe friction, tank backpressure).
Inlet Volume Flow (Q): The Y-axis represents Inlet Volume Flow Rate. This is crucial: it’s the volumetric flow of gas at the inlet conditions of the blower, often labeled as ICFM (Inlet Cubic Feet per Minute) or m³/min. This differs from SCFM (Standard Cubic Feet per Minute), which is flow corrected to standard temperature and pressure conditions. Performance curves are based on ICFM; confusing the two is a common source of sizing errors.
BHP (Brake Horsepower): Overlaid on the flow-pressure map, you’ll find lines or curves indicating the required Brake Horsepower. BHP or KW is the mechanical power input required at the blower’s shaft to achieve a given flow and pressure. This value is essential for selecting the correct motor size and ensuring you don’t overload it.
3. Key Relationships You Must Know
The shape of the curves reveals the fundamental physics of the Roots blower.
How Speed, Pressure, and Flow Interact
Flow vs. Speed (Linear Relationship): For a given blower, the theoretical flow is directly proportional to its speed (RPM). This is because a Roots blower displaces a fixed volume of air with each revolution. If you double the RPM, you double the theoretical flow. On the performance chart, this is seen as a series of nearly vertical, parallel lines for different RPMs.
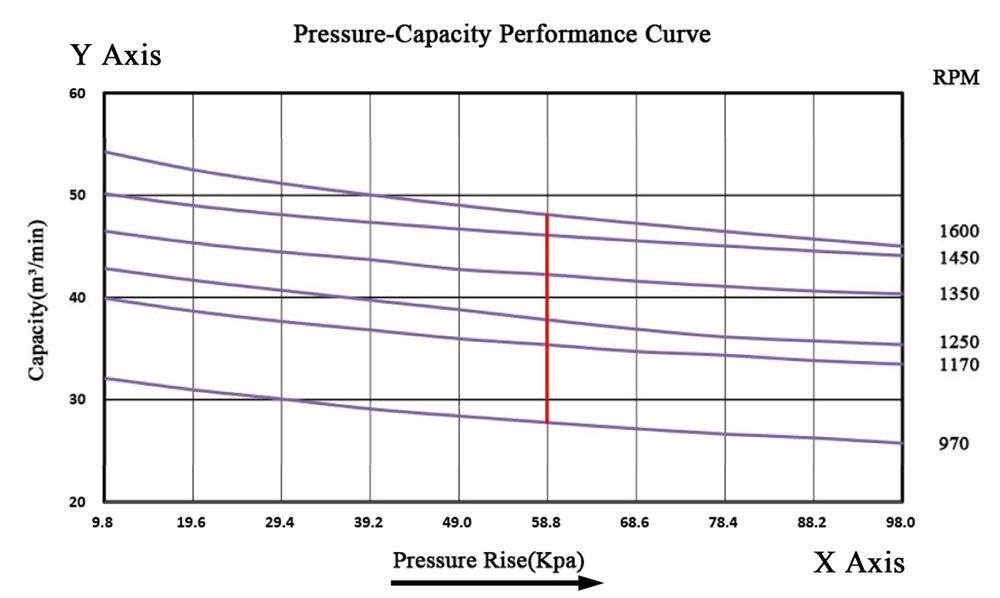
Slip and Volumetric Efficiency: Why are the RPM lines not perfectly vertical? This deviation is due to Slip. Slip is the internal leakage of gas from the high-pressure outlet side back to the low-pressure inlet side through the clearances between the rotors and the housing. As the outlet pressure (ΔP) increases, the driving force for this leakage increases, causing the actual delivered flow to be less than the theoretical displacement. This is why the RPM lines curve slightly to the left at higher pressures. Volumetric efficiency is the ratio of actual flow to theoretical flow, and it decreases as pressure rises.
Temperature Rise: A critical, often overlooked, relationship. The work done to compress the gas (even in this nearly adiabatic process) and overcome mechanical friction results in a significant temperature rise. The higher the ΔP, the greater the temperature increase. Performance charts often include a “Maximum Allowable Temperature” or “Temperature Rise” limit line. Operating near or beyond this line can lead to premature wear, thermal expansion issues, and oil breakdown in lubricated units.
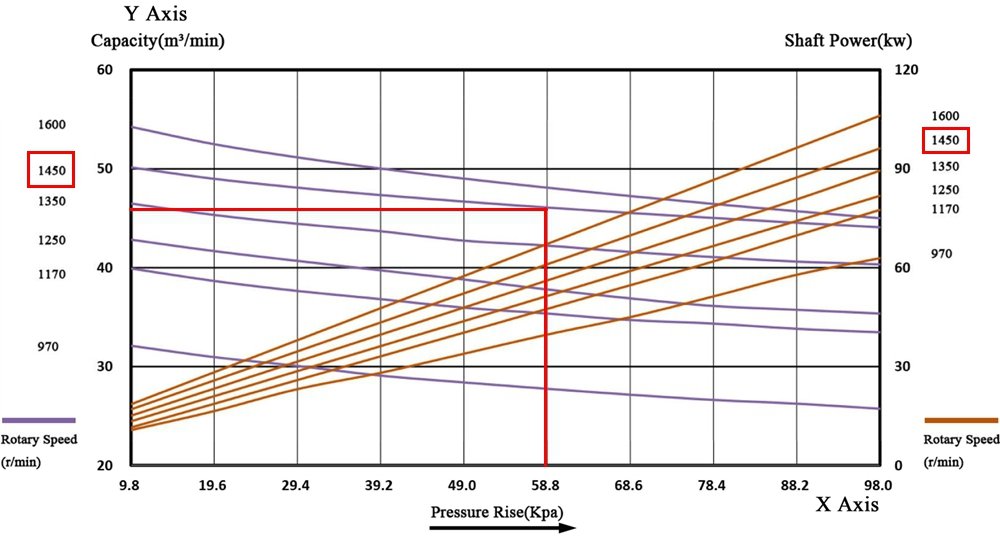
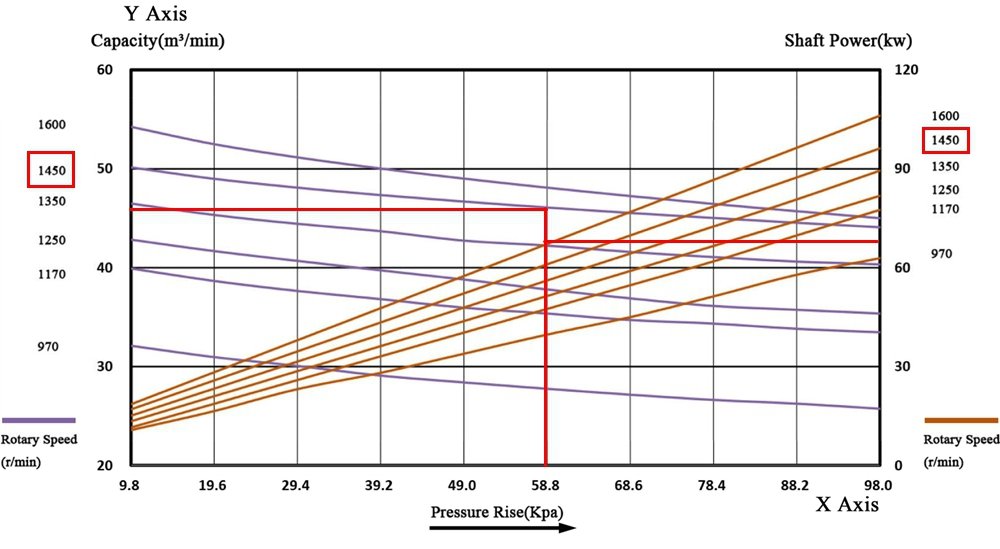
4. Step-by-Step: How to Plot Your Requirement
Let’s apply this knowledge to find your blower’s operating point.
Finding Your Operating Point on the Chart
Follow this numbered process to size or verify your blower selection accurately:
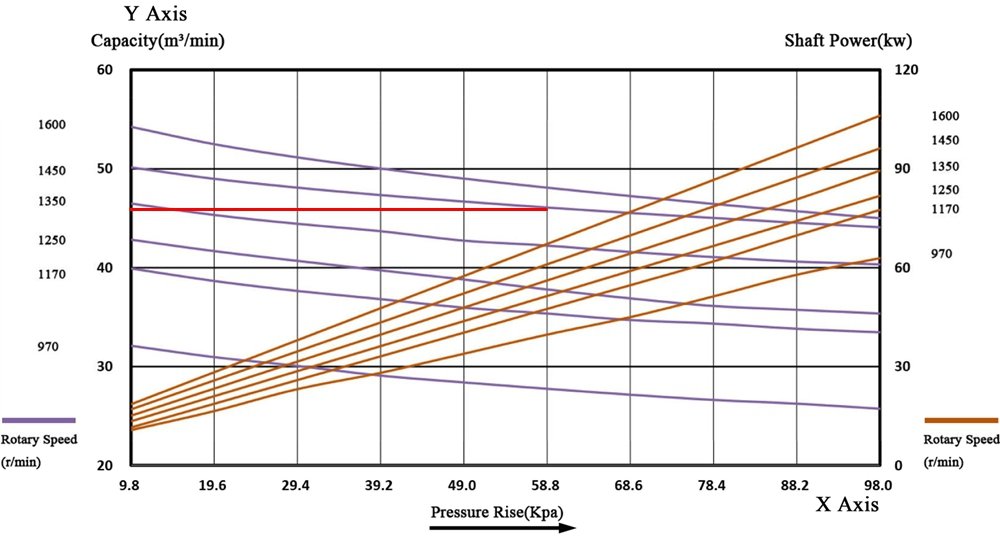
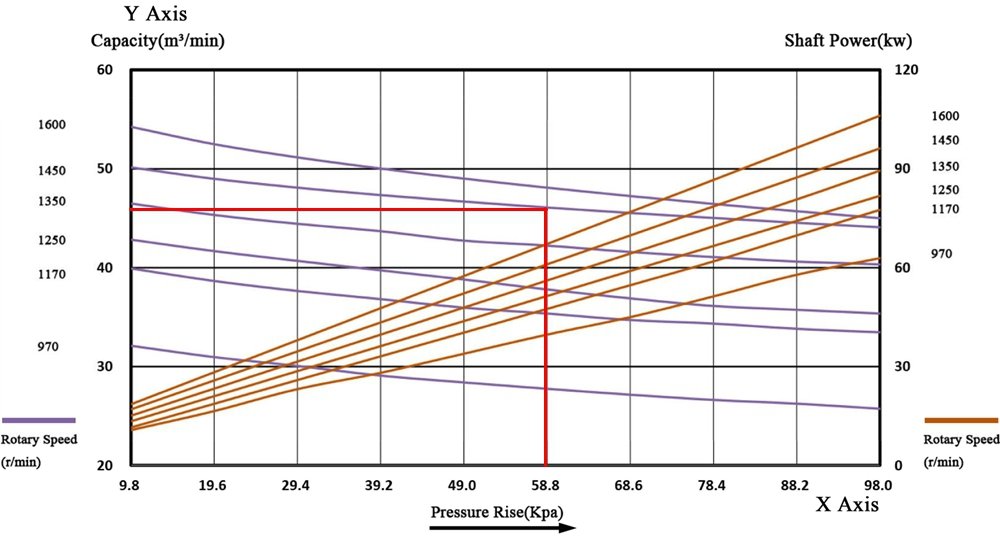
- Determine Your Target Pressure (ΔP): Calculate the total system resistance your blower must work against. This includes all pressure drops from filters, piping, valves, and the vessel’s static pressure.
- Determine Your Required Flow (ICFM): Specify the volumetric flow rate needed for your process at the blower’s intended inlet conditions (temperature, pressure, humidity).
- Locate the Intersection: On the performance chart, find the vertical line corresponding to your required flow (Step 2). Follow it upward until it intersects the horizontal line corresponding to your target pressure (Step 1). This intersection is your target Operating Point.
- Read the Required Power and RPM: From the operating point, identify which RPM curve it lies on or between (you may need to interpolate). Then, read horizontally to the power (BHP) axis to find the required shaft horsepower at that exact condition.
5. Critical Factors That Shift the roots blower performance Curve
The published curve is based on standard conditions. Your site conditions will “shift” the effective performance.
Environmental and Site Adjustments
Altitude and Inlet Pressure: At higher altitudes, atmospheric pressure is lower. Since a Roots blower is a volumetric device, it will still draw in the same volume (ICFM), but the mass of air (which determines the actual process effect) will be lower because the air is less dense. You must correct for density to ensure you deliver the required mass flow. Effectively, for the same ICFM, the blower’s capability to do work is reduced.
Inlet Temperature Changes: Cold inlet air is denser than hot air. A blower operating in winter will draw in a higher mass flow for the same ICFM compared to a hot summer day, potentially overloading the motor. Always consider seasonal temperature variations.
Specific Gravity (Gas Type): If you are moving a gas other than standard air (e.g., methane, nitrogen), its density (Specific Gravity) changes the power requirement dramatically. The flow-pressure curve remains largely unchanged for a volumetric blower, but the Brake Horsepower (BHP) curve must be adjusted. Power is directly proportional to gas density. A heavier gas requires more power.
6. Common Red Flags to Watch For
A curve doesn’t just show where to operate—it also warns you where not to operate.
Reading Between the Lines: Avoiding Failures
- Dead End / Over-pressure: Every curve has a maximum pressure limit, often called the “pressure cut-off” or “dead-end” point. Operating beyond this point provides no additional flow and creates excessive stress, heat, and wear, leading to rapid failure.
- Motor Overload: Your operating point’s required BHP or KW must always be below the rated horsepower of your drive motor, with a proper service factor included. An operating point that sits on or above a BHP or KW line greater than your motor’s capacity is a direct path to tripped breakers and burnt-out windings.
7. Conclusion
A Roots blower performance curve is a living document. Periodically comparing your actual system data (amp draw, outlet temperature, delivered flow) against the projected operating point on the original curve is a powerful predictive maintenance tool. It can reveal issues like fouling, filter clogging, or internal wear before they cause downtime. In summary, learning to read these curves fluently is not just an academic exercise—it is a critical practice that directly translates to extended equipment lifespan, optimized energy consumption, and guaranteed process reliability.